Analysis and Comparison of Gross National Product of Iran and Other Countries – Power BI Dashboard Design
Created By: Saeed Khoshtalab
Date: 06/09/2025
Client: International Monetary Fund Data Analytics Dashboard Design Competition
Categories: Content
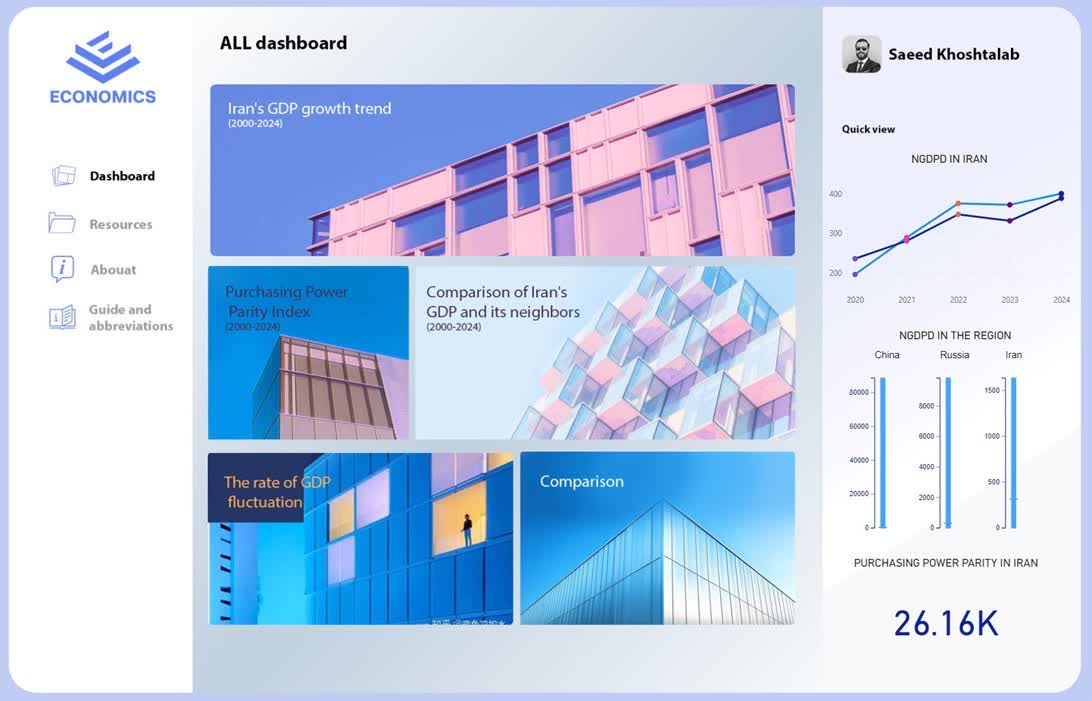
This Power BI dashboard, titled “Analysis and Comparison of GDP of Iran and Other Countries”, is designed for the Iranian economy and focuses on analyzing macroeconomic indicators from 2000 to 2024.
In different sections of the dashboard, charts and visual cards related to the following can be seen:
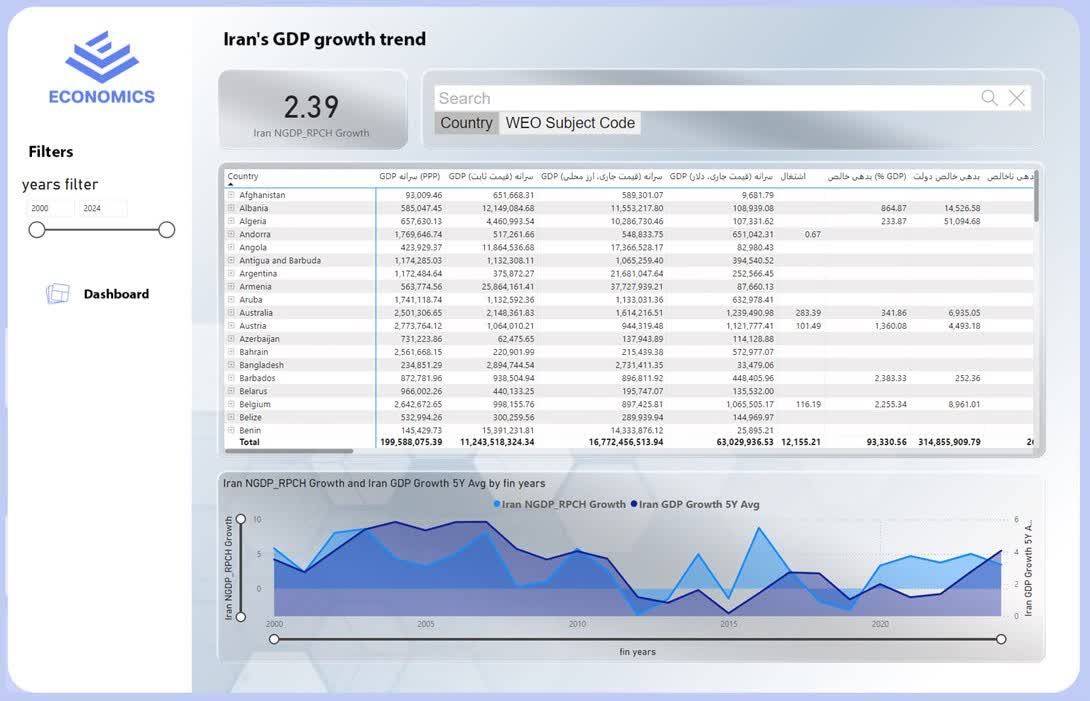
GDP growth trend of Iran (2000–2024)
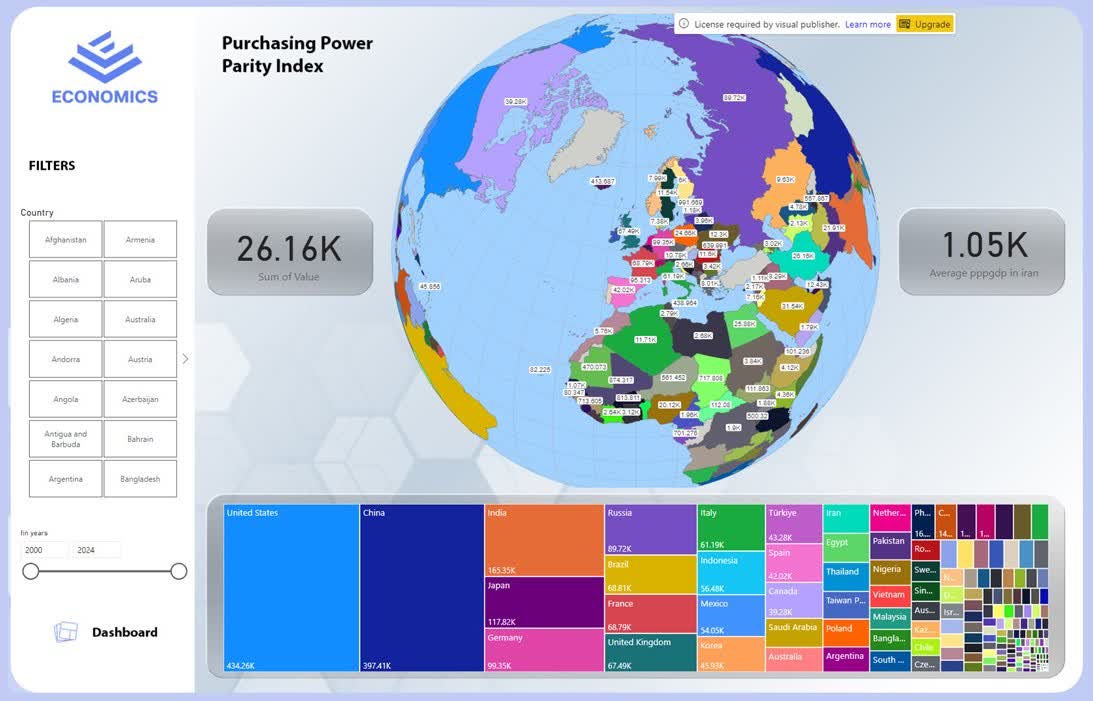
Purchasing Power Parity Index
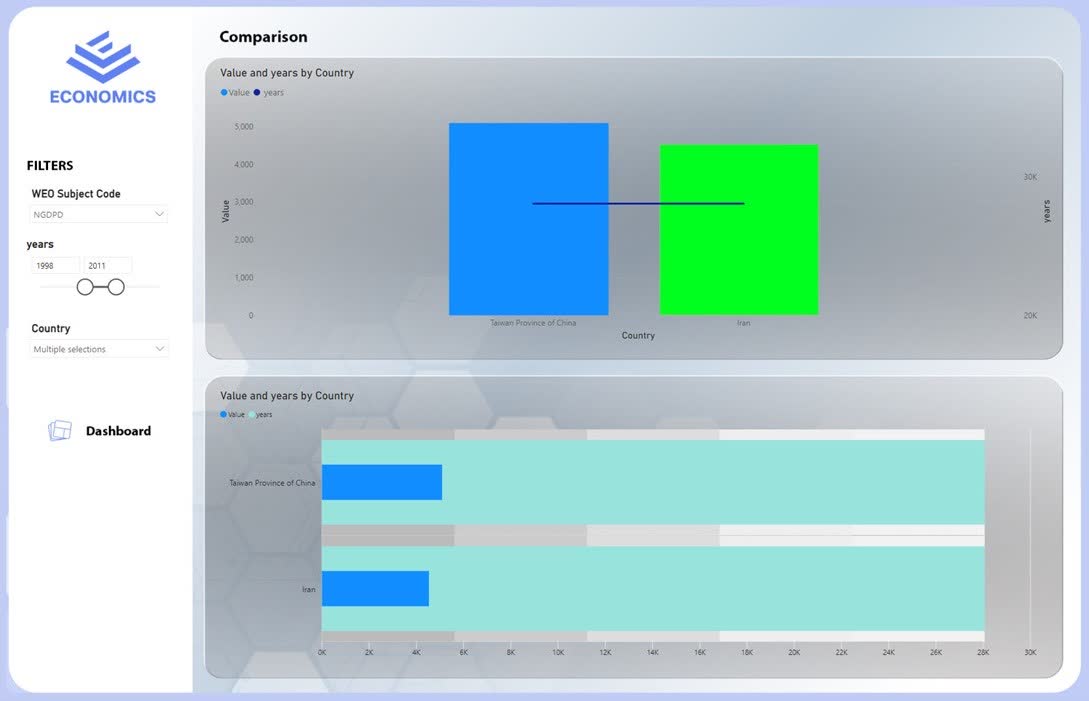
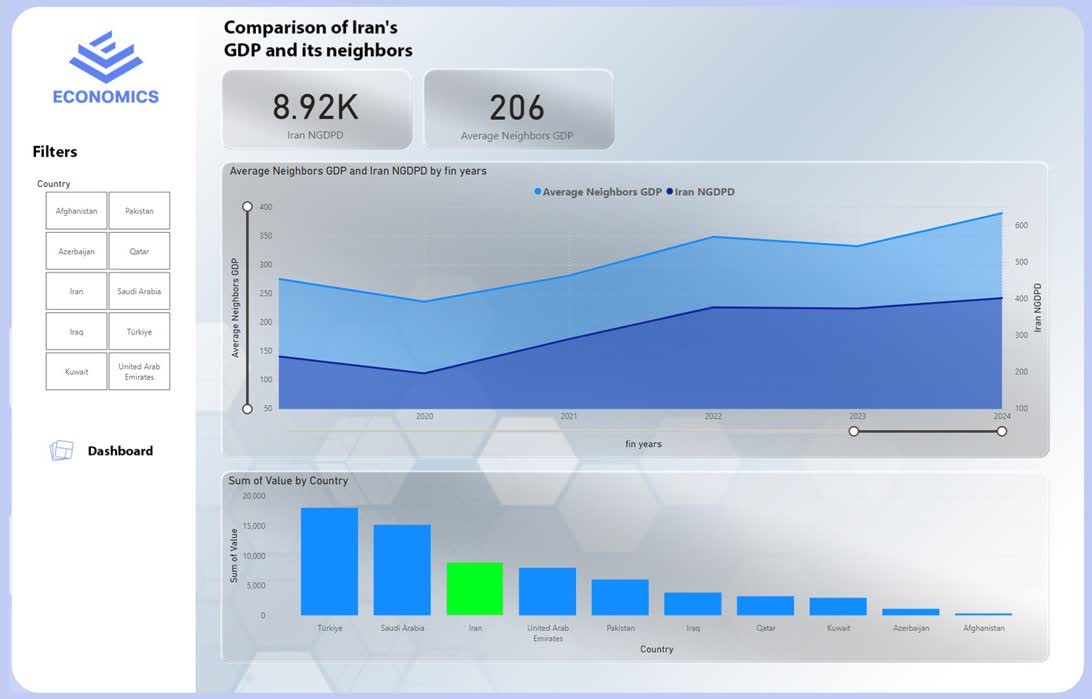
Comparison of Iran’s GDP with neighboring countries
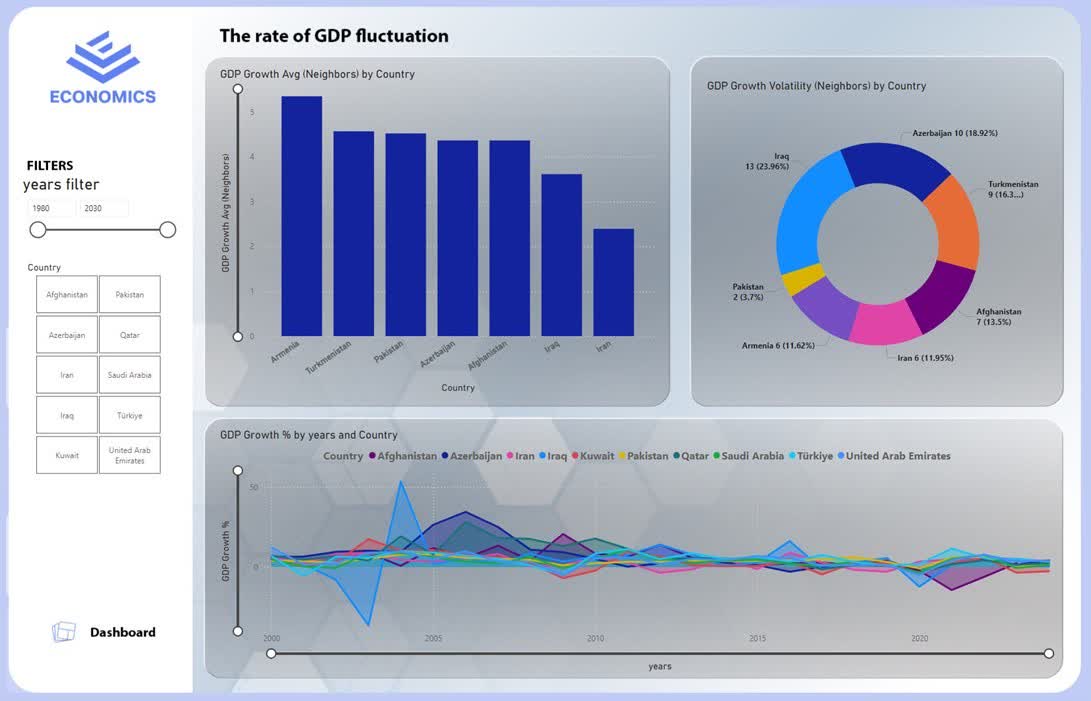
GDP fluctuation rate over time
On the right side of the dashboard, an overview (Quick View) of the Gross Domestic Product (NGDPD) trend in Iran and its comparison with China and Russia is presented. At the bottom, the overall PPP index value for Iran (26.16K) is displayed.
In terms of design, the dashboard has a modern and minimal user interface, with a combination of blue and purple colors, side menus for quick access to different sections, and an attractive visual view for each topic. This dashboard is designed for comparative analysis and economic decision-making by managers and analysts.